
Import Data from Planning Space
The Planning Space Data Source enables you to import directly from Planning Space Applications:
- Opportunity input data (time series and scalar)
- Opportunity Attributes
- Selection Constraints, Dependencies, and Selection Groups (default or customized with variables)
- Project Start Dates as Base Selections (either system start dates or customized with variables)
One scenario may be populated with selection constraints representing current opportunity timing.
Click image to expand or minimize.
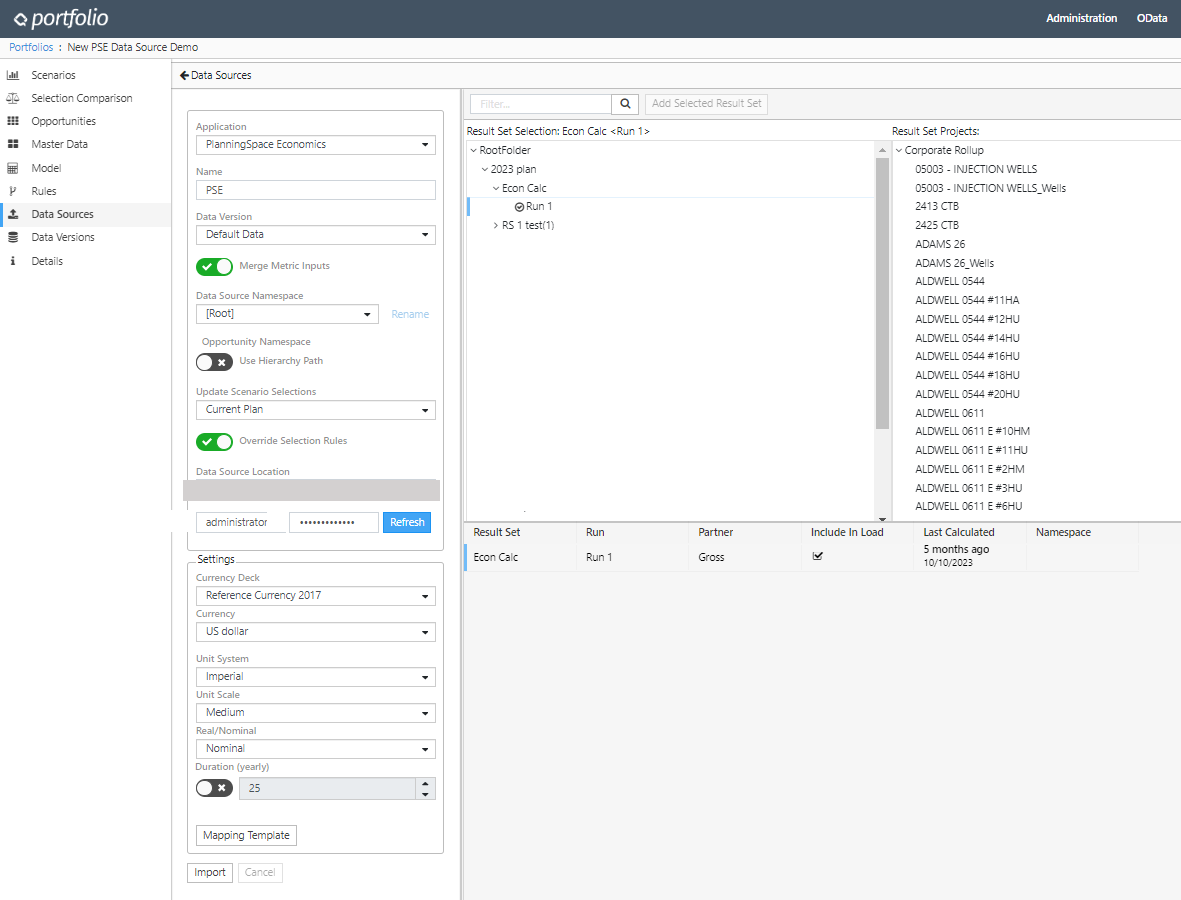
Configure the Planning Space Data Source
- On the Data Sources page, click Add Data Source and select Planning Space.
- Complete the following fields:
- Click Connect.
- Specify the Planning Space Settings you require. These settings are applied globally for every Opportunity created in the import:
- Version (PS Dataflow only)
- Revision (PS Dataflow only)
- Currency Deck (Read-only in PS Dataflow)
- Currency
- Unit System
- Unit Scale
- Real/Nominal
- Duration (yearly)
- Once a connection is active, you will see a current list of Dataflow Documents or Economics/Financials Result Sets.
- Select one or more Dataflow Document Types and a Hierarchy Start Node, or
- Select a Run from one or more Economics or Financial Result Sets in the list. One Run per Result Set is supported.
- Click Add Selected Results Set to add the selections to the list.
- For PS Economics or Financials, configure the grid selections:
- Partner: select the partner type from the list
- Include in Load: choose whether result sets from previous imports should be included in the current import
- Last Calculated: read-only information regarding the status of the result set in Planning Space
- Namespace: Add an import label to all Opportunities in the Result Set. This is the third level of namespace in imports, and is appended after other Namespaces if present, I.e., Data Source/Opportunity/ResultSet.
- Click Mapping Template to configure the mapping template (see below).
- Click Import.
| Field | Description |
|---|---|
| Application | Choose from: Dataflow 20.x, Economics, or Financials. |
| Name | Data Source Name |
| Data Version | Select a Portfolio data version to populate (add / manage versions from the Data Versions page). |
| Merge Metric Inputs | Toggle on to merge new metric data with existing metric set. Off will zero out existing input data prior to import. |
| Data Source Namespace | Add an import label to all Opportunities in the import. This is the highest level of namespace in imports. |
| Opportunity Namespace | Toggle the option to include Planning Space hierarchy paths as a namespace. This is the second level of namespace in imports, and is appended to Data Source Namespace if present. |
| Apply Base Selections to Scenario | Select a Scenario to import Project Start Dates as selections. |
| Override Selection Rules | If Update Scenario Selections is active, this option will insert the Project Start Date as a Selection Constraint Rule |
| Data Source Location | Enter the location url of the Planning Space tenant that you wish to connect to. A default location may be populated. |
| Credentials | Enter your Planning Space username and password. |
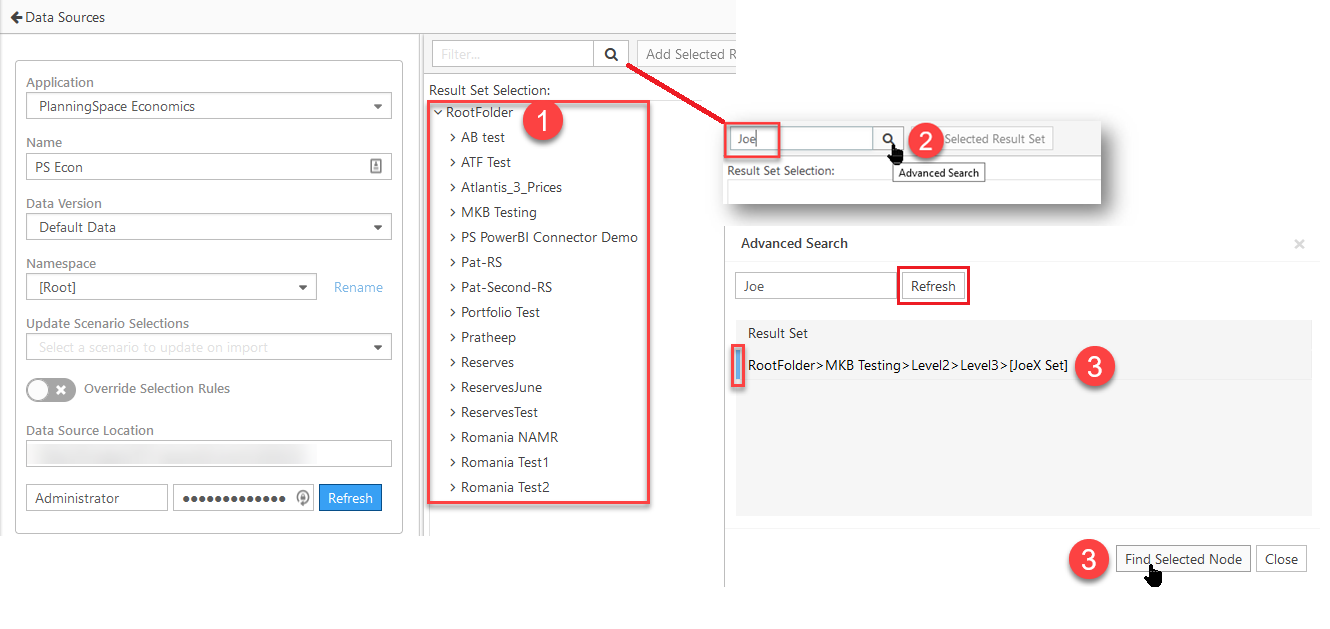
Economics/Financials - The Results Set Selection Panel
When a Planning Space Economics or Financials connection is active, a Result Set hierarchy is displayed.
- The root level folders in Planning Space are displayed by default.
- Any previously loaded and saved Result Set nodes are expanded by default.
Use the Advanced Search tool to find and expand deeper nodes:
- Only the top level is displayed by default
- To search Results Sets, type a Result Set search string and click on the Advanced Search icon
- Refresh the search list, click on the required result set in the results list, and click 'Find Selected Node'
Click image to expand or minimize.
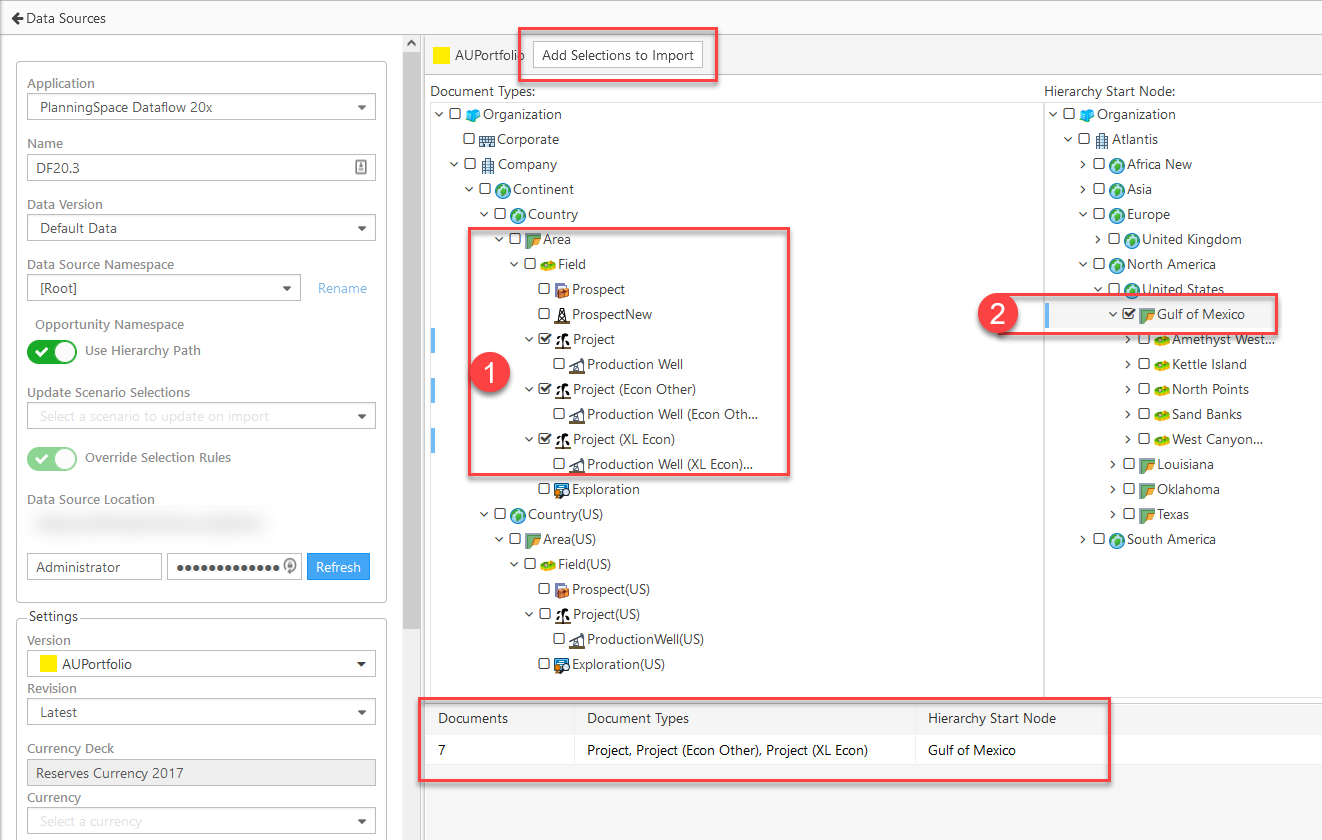
Dataflow - The Document Types and Hierarchy Start Node Panels
When a Dataflow connection is active, a Document Types and Hierarchy Start Node panel is displayed.
- Select one or more document types. Each document type included in the import will be created as a Portfolio Opportunity.
- Select a Hierarchy Start Node. All selected document types included in folders from the start node folders are included in the import. The expected number of documents is displayed once the selections are added to the Import.
Click image to expand or minimize.
Configure the Mapping Template for a Planning Space Data Source
Outcomes (Dataflow only), Metrics, Attributes, Selection Rules, and Opportunity time normalization can be mapped to Planning Space Variables.
- Input Metrics and Attributes can be auto-created from Planning Space variables. The Planning Space 'Display Name' is added as a metric or attribute name.
- Unit labels may be imported with the metric name and data.
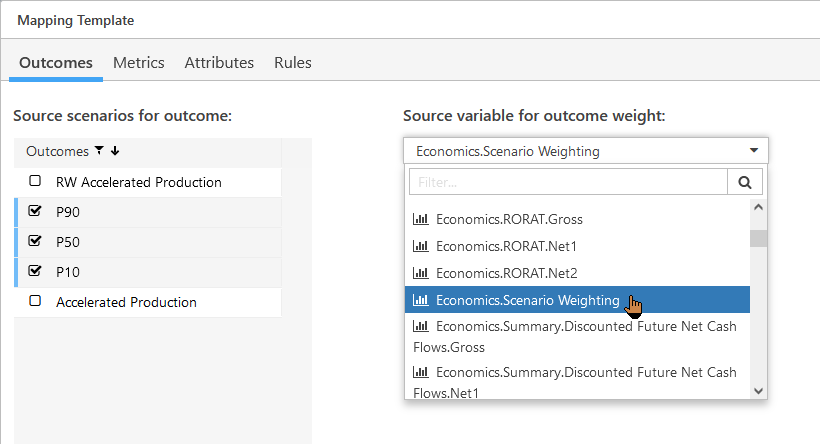
Outcomes Tab (Dataflow only)
A list of Dataflow Scenarios is displayed once a connection is active and a valid selection of Document Type and Start Node is selected.
- Each selected Scenario will be included as an Outcome in Portfolio.
If a variable in Dataflow is used to capture Scenario Weight in any document templates, that variable can be mapped and will be used to determine Outcome Weights.
- Without a mapped variable, all Scenarios are imported with weight = 1.0. These can be edited post-import.
- If a variable is included in the mapping, matching Scenarios will use the weight, otherwise they are imported as 1.0 and can be edited post-import.
Click image to expand or minimize.
Metrics Tab
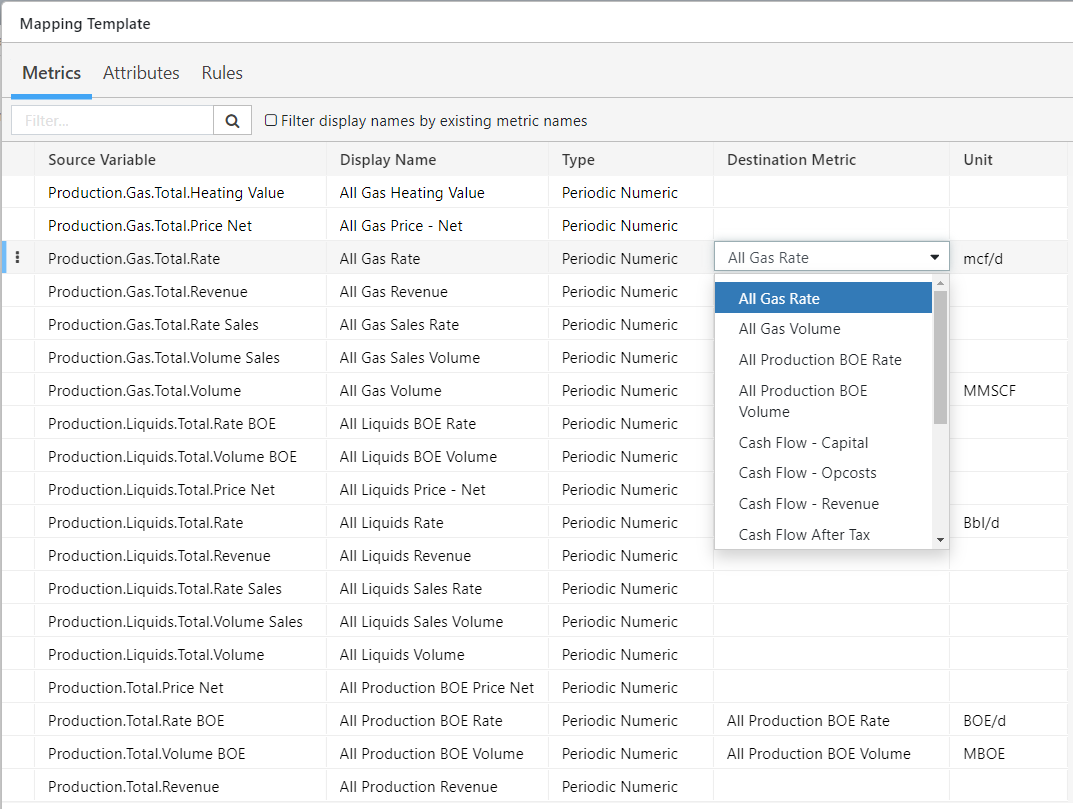
A list of Planning Space variables is automatically populated. Mappings to existing Metrics can be added by clicking the required row in the Destination Metric column.
Each mapping requires a source variable from Planning Space Economics to be mapped to a destination Metric in Portfolio. Each of the mappings has a text filter that can be used to filter down to the variable and metric that is required. The user can create as many metric mappings as required.
Click image to expand or minimize.
Planning Space variables are populated in the Source Variable list.
Map Planning Space variables to Portfolio Metrics using the Destination Metric drop-down list. Unit labels will be retrieved from Planning Space when a metric is mapped, but may be removed if the user does not want to include the unit label.
If Portfolio Metrics have already been created that exactly match Planning Space source variables, they can be automatically matched. The match is based on the Planning Space Display Name.
- Select the ‘Filter display names by existing metric names’ checkbox
- The Source Variable list is filtered to those that can be mapped to matching Portfolio Metrics
- Multi-select variables to map in bulk
- Select ‘Map to Display Name’ from the sub-menu in the Mapping Template
- The Destination Metric column is populated with the matching Planning Space variable names
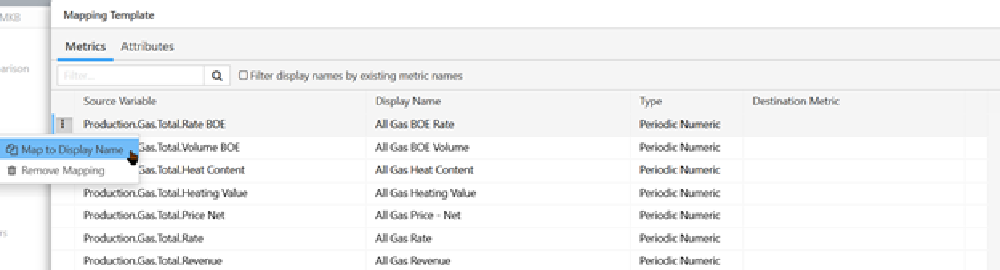
To create a Portfolio Input Metric directly from the Planning Space import:
- Multi-select variables to map in bulk.
- Select Map to Display Name from the sub-menu in the Mapping Template.
The Destination Metric column is populated with the Planning Space Display Name. New metrics will be created on import.
Mappings can be removed using the Remove Mapping selection.
Click image to expand or minimize.
Attributes Tab
Each of the mappings has a text filter that can be used to filter down to the variable and metric that is required. The user can create as many attribute mappings as required.
A list of Planning Space source variables is automatically populated in the list. Just as for Metrics:
- Mappings to existing Attributes can be added by clicking the required row in the Destination Attribute column.
- Automap Planning Space variables to matching Portfolio Attributes by filtering with the ‘Filter display names by existing attribute names’ checkbox. Use Map to Display Name to populate the Destination Attribute.
- Create a Portfolio Attribute by populating the Planning Space variable in the Destination Attribute with Map to Display Name.
Rules Tab
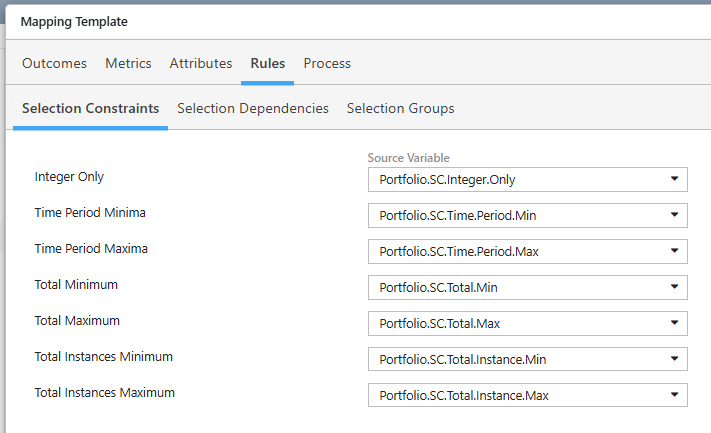
Selection Constraints
Selection Constraints may be defined from Planning Space Variables of the appropriate types. Property variables should be used where possible (Dataflow), or force equality between all scenario variables (Economics / Financials). There may only be one set of Selection Constraint variables per opportunity. The following variables may be mapped:
- Integer Only – Text
- Total Minimum – Numeric
- Total Maximum – Numeric
- Total Instances Minimum – Numeric
- Total Instances Maximum – Numeric
- Time Period Minima – Periodic Numeric
- Time Period Maxima – Periodic Numeric
- Where Project Start Date = Portfolio Start Date, no shifting or truncation (date shown = final Selection Constraint date)
- Where Project Start Date < Portfolio Start Date, truncation of prior time periods (date shown = final Selection Constraint date)
- Where Project Start Date > Portfolio Start Date, Selection Constraint data will be shifted to the Portfolio start date.
Click image to expand or minimize.
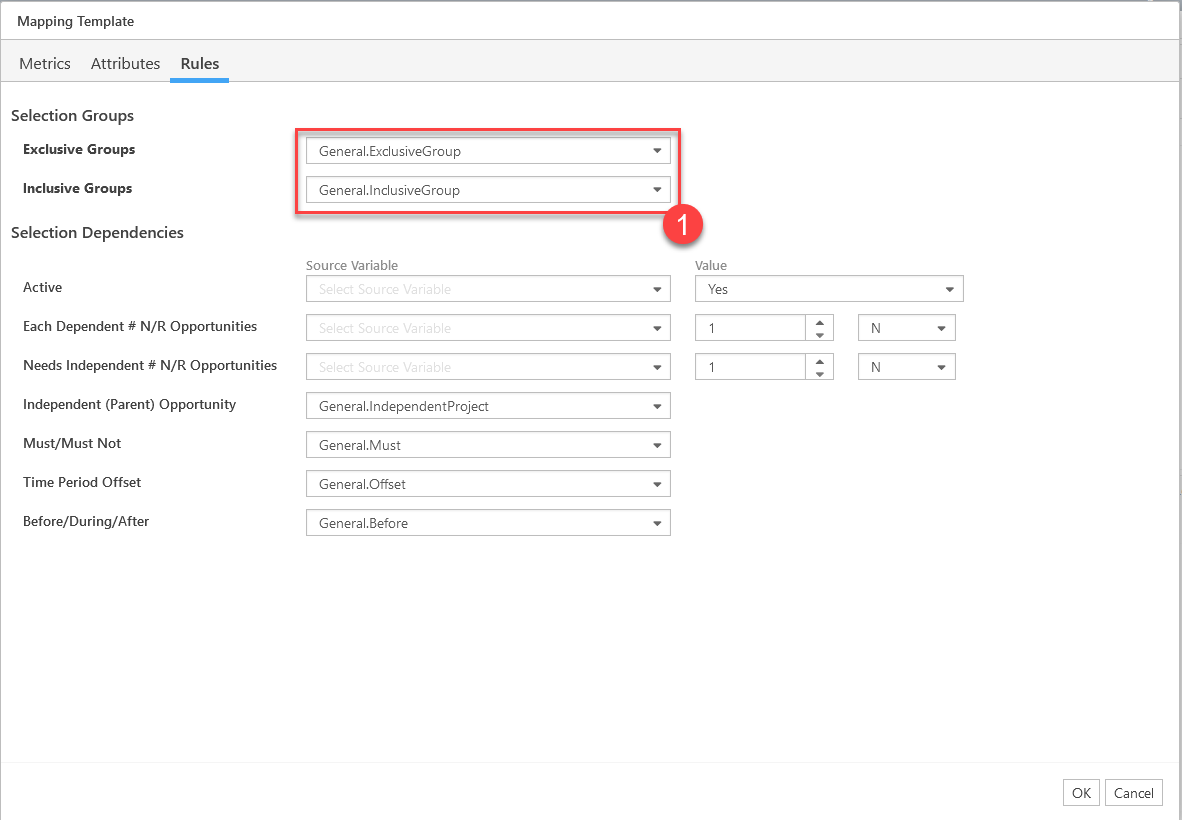
Selection Groups
Selection Groups can be constructed in Portfolio by importing components from Planning Space attribute variables.
Click image to expand or minimize.
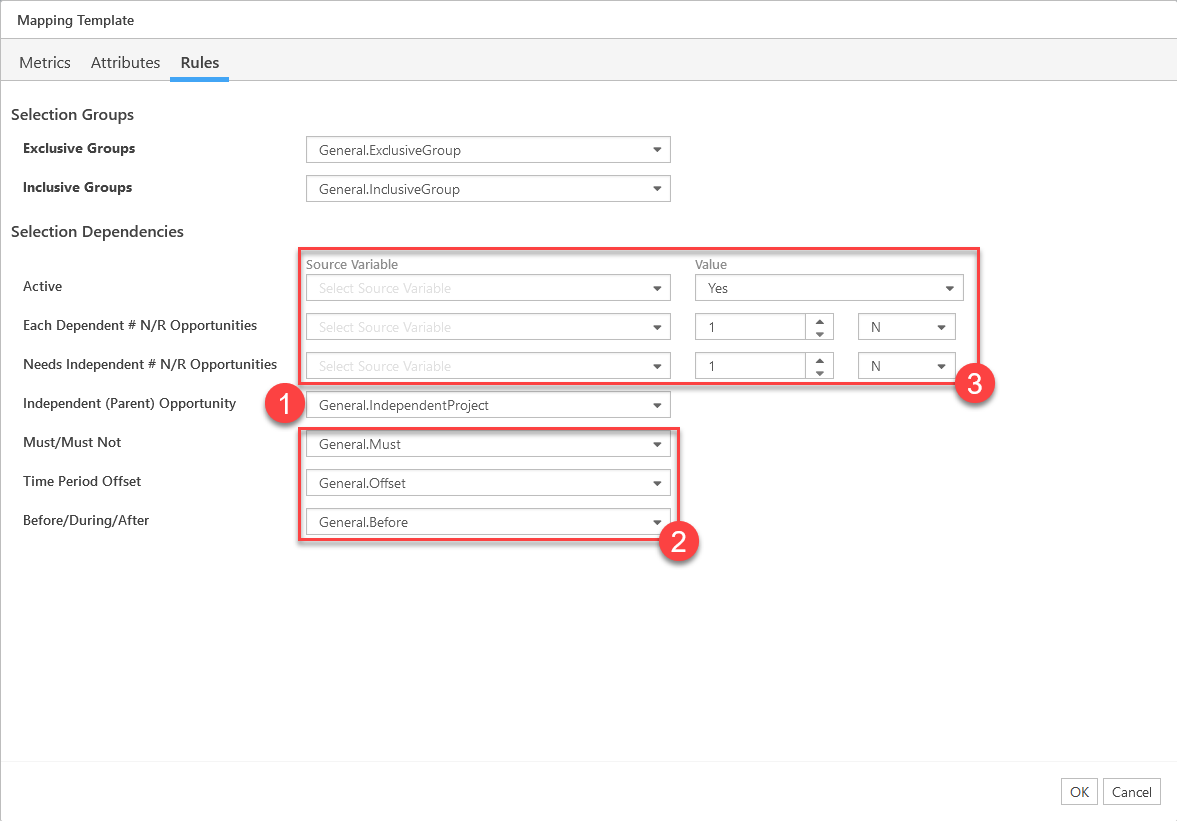
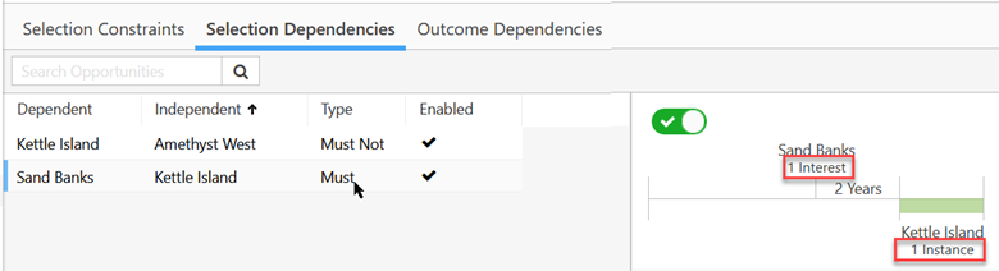
Selection Dependencies
Selection dependencies can be constructed in Portfolio by importing components from Planning Space attribute variables.
Click image to expand or minimize.
- Select a Source Variable mapping for the Independent (Parent) Opportunity. A mapping in this field is required to initiate the dependency import.
- Select Source Variable mappings for Must/Must Not, Time Period Offset and Before/During/After.
- Either select Source Variable mappings for Active, Each Dependent and Needs Independent or override all Selection Dependencies with the same values by entering parameters as a Value. Where N/R represent the type of selection scaling: N = Instance, R = Interest
Click image to expand or minimize.